Human supervision & annotation of data will increase in importance, and numerous tools are being developed to accelerate the annotation and enrichment of data.
Introduction
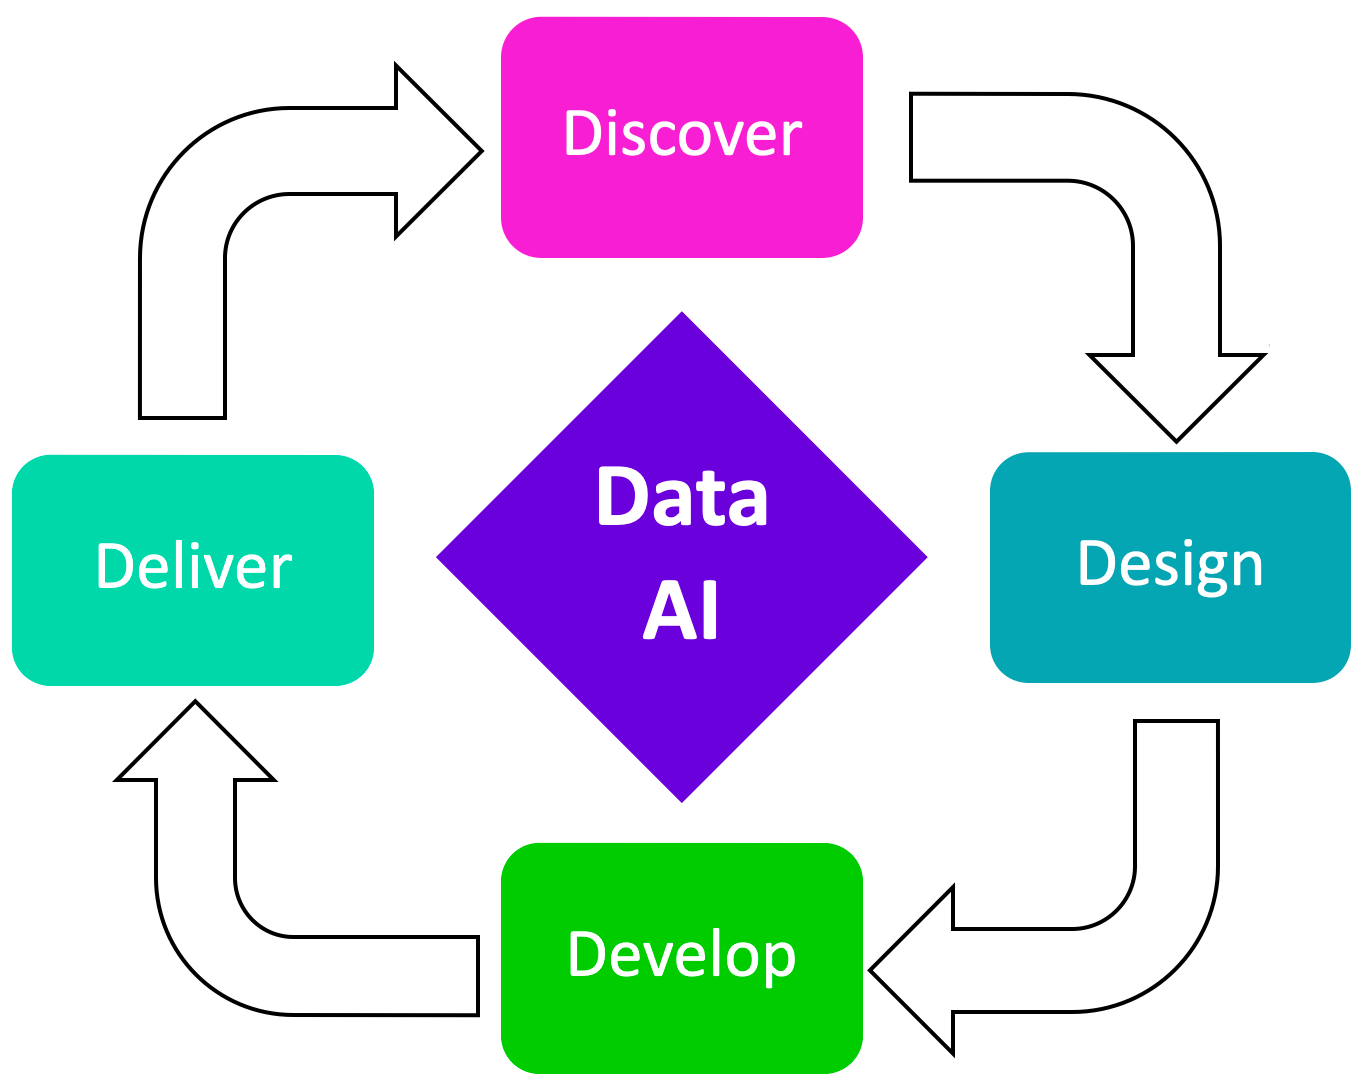
I like to think of data as having four dimensions;
- Data Discovery
- Data Design
- Data Development
- Data Delivery
Data Discovery can consist of a number of layers of refinement; eventually reaching a very granular level of classification. We have already seen the introduction of nested or sub-intents in a few chatbot development frameworks.
A first step in Data Discovery can include data visualisation; a recent project which is focussed on visualising RAG data attracted quite a bit of attention.
Embeddings
In simple terms, embeddings are used to create a spacial representation or mapping, of sentences or chunks of data. This spacial representations are based on the semantic meaning of text; and hence text which have the same semantic meaning are clustered together.
When these clusters are displayed visually, it creates a visual representation of what topics/intents/classes are more prevalent. It also helps in finding outliers and conversations or topics not discovered previously.
Data visualisation is the presentation of data in a graphical or visual format. The goal of data visualisation is to communicate complex information in a simplified and understandable way, making it easier to detect patterns, trends, and insights from the data.
Bulk
Bulk is open-source code which make it easy to experiment with embeddings and visualisation.
Data Preparation
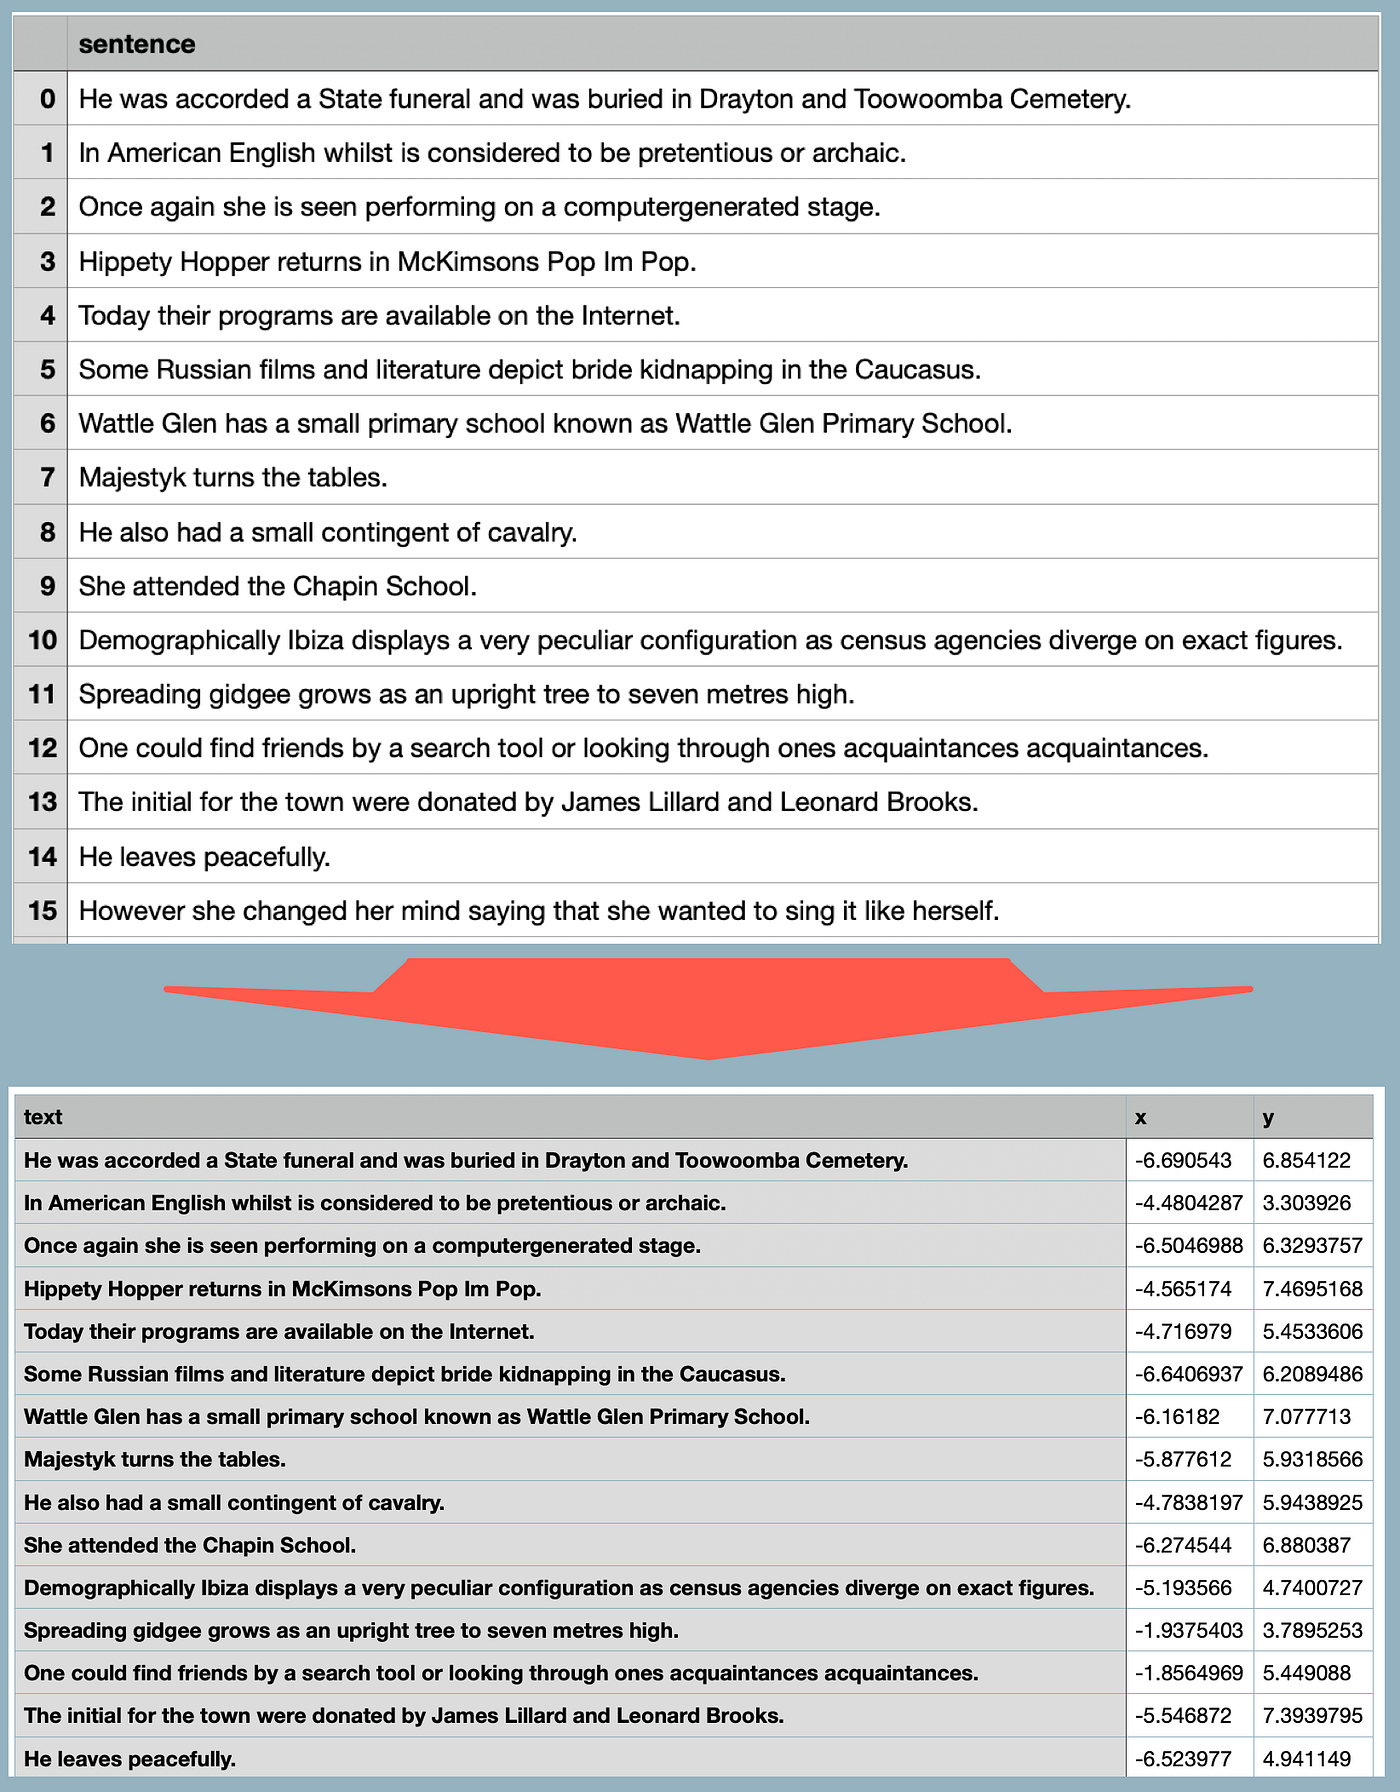
For this demo I downloaded a list of sentences from Kaggle; in total I made use of 1,035 sentences. In the image below, the top section shows the sentences in a CSV file.
The bottom section shows a CSV where the embeddings are created for the utterances. Notice the x and y fields added to the end.
These coordinates represents the semantic similarity of the sentences. This data set contains sentences which are very ambiguous in meaning; hence the signal is not strong. Data from an enterprise or customer conversations should have a stronger signal and hence better defined classifications.
The code below is working Python code to run the embeddings and CSV creation process in a notebook. I made use of Colab to run the code, and upload and download the CSV files.
You might notice that the code look different to that on the Github page; but I needed to make some changes to get it to work.
import umap.umap_ as umap

import pandas as pd
import umap.umap_ as UMAP
from sklearn.pipeline import make_pipeline


import pandas as pd
import umap.umap_ as UMAP
from sklearn.pipeline import make_pipeline

# pip install "embetter[text]"
from embetter.text import SentenceEncoder

# Build a sentence encoder pipeline with UMAP at the end.
text_emb_pipeline = make_pipeline(
  SentenceEncoder('all-MiniLM-L6-v2'),
  umap.UMAP()
)

# Load sentences
sentences = list(pd.read_csv("/original.csv")['sentences'])

# Calculate embeddings
X_tfm = text_emb_pipeline.fit_transform(sentences)

# Write to disk. Note! Text column must be named "text"
df = pd.DataFrame({"text": sentences})
df['x'] = X_tfm[:, 0]
df['y'] = X_tfm[:, 1]
df.to_csv("/ready.csv", index=False)
Visualisation
After installing Bulk with this command:
python -m pip install --upgrade pip
python -m pip install bulk
The application can be run with the command:
python -m bulk text ready.csv
A web instance is launched, with the text on the right, and the visual representation on the left. There are a number of tools available to interrogate the visual representation.
Each dot, represents a sentence; and as a selection is made, the text is displayed on the right. These groupings can be used to created initial classes or intents for more granular refinement.
In the image below, I ran the command with a number of keywords; adding key words colour codes the sentence nodes in the visual representation.
python -m bulk text /ready.csv --keywords "bands, book, dog"
Below the outlier cluster shown in orange, which are related to dogs and pets.
Conclusion
In principle, data discovery refers to the process of
- Identifying,
- Collecting, and
- Analysing Data.
Most often this takes place in an organisation as a first step in following a data-centric approach to AI.
It involves the exploration and understanding of data sources, structures, and patterns to uncover valuable information. The goal of data discovery is to extract meaningful and actionable knowledge from large and complex datasets.
Key aspects of data discovery include:
- Data Identification: Identifying the various data sources within an organisation, including databases, files, applications, and external sources.
- Data Collection: Gathering and consolidating data from different sources into a centralised location for analysis.
- Data Exploration: Investigating and exploring the data to understand its characteristics, relationships, and potential insights. This often involves visualisations and statistical analysis.
- Pattern Recognition: Identifying patterns, trends, outliers, and correlations within the data that may provide valuable information for decision-making.
- Data Discovery and Data Design are interconnected phases within the broader data management lifecycle.
Data discovery provides the foundational understanding of existing data within an organisation, while data design involves planning and creating a structured framework for organising and managing data effectively.
Find Bulk on GitHub.
Previously published on Medium.